Sunday, May 30, 2010

Japanese farming: A tale of incentives and externalities


On my first trip to Japan I was astonished by the prevalence of rice paddies in dense urban areas. A friend I was visiting mentioned that he occasionally had to cycle around a rice harvest from the plot next door on his apartment driveway. Throughout the city little patches of green space were being used for some kind of vegetable farm or rice paddy.

Why is this? What is so peculiar about Japan that people would forgo higher value urban land development to grow rice?

It turns out this pattern of farming is the result of Japanese agricultural subsidies. The treatment of capital gains from farmland provides an incentive to maintain some form of agricultural use, while local planning regulations provide direct and indirect subsidies for continued agricultural use of land. Also, a key factor is the political power that can be gained from manipulating complex agricultural regulations. This research

…explains the political dynamics whereby traditional small farming communities are powerful voting groups that prefer to maintain their political power rather than increase farm income. By exerting political pressure upon the authorities, farmers can obtain large returns through the manipulation of farmland-use regulations, even though such manipulation causes social harm by preventing efficient land use.

The research starts with the premise that inefficient small scale agriculture, rather than large scale efficient agriculture, is social burden. However, as a visitor I found that these patches of agriculture provided a social service of open space and a degree of community connectivity, with neighbours becoming involved with the harvesting and eating of produce.

Japan’s agricultural subsidies and town planning limit sprawl and encourage agricultural production, but at a cost of giving much political power to those who remain in agriculture.

On a less serious note, the rice paddy art trend in Japan provides another positive externality from small scale agriculture in urban areas (follow the link to a sequence of photos from planting to harvest).

Thursday, May 27, 2010

Induced traffic, super profits, and 3D TV


Induced traffic (a type of rebound effect) should be a major concern for Campbell Newman’s TransApex money pit. One would think that the need to duplicate the Gateway Bridge just 19 years after its completion was evidence enough that road space does not improve travel times for very long. We don’t want a city that looks like the picture above in another 20 years.

On that topic, I drove across the William Jolly Bridge on Monday at 4.30pm, and Thursday at 9am. I was alone on the bridge. I fear that the Hale St Bridge, at $1.50 then $2.70 each way, will be completely empty except for maybe a couple of hours each weekday – surely not a good way to spend $370million.

Ken Henry defends the Super Profits Tax on mining against a wave of political and media misunderstanding and misrepresentation. Whether the government adopts Henry’s ideal version of the tax, or some other politically modified version (or none at all), remains to be seen.

An interesting history of the private provision of public goods

3D Cinema and TV – how does it work and why can’t a normal TV project images that trick the eye into seeing 3D?

Monday, May 24, 2010

Update: Tax me, please

Last year I wrote about the important social benefits of land taxes compared to other forms of taxation. My headline was Tax me, please (also cross-posted at Online Opinion).

Maybe it is just a coincidence, but Mark Carnegie’s outstanding piece on the best recommendations from the Henry Tax Review, including the land tax as a substitute for transactions taxes such as stamp duties, is entitled Tax me!

Carnegie’s article sums up my thoughts on the Henry review and is worth reading in its entirety, but here is a taste.

“… economic growth would be higher if governments raised more revenue from land and less revenue from other tax bases.”

“When a government builds a new railway line and the value of the surrounding property soars, surely it is right that this wealth be taxed.” The same is true of people who get dairy farms on the edge of cities rezoned as residential land in quarter acre blocks. As Churchill said, “To not one of these improvements does the land monopolist, as a land monopolist contribute, and yet by every one of them the value of his land is enhanced...”

We all hate paying more tax than we have to but Ken Henry has written a document that is a compelling argument for how to build a better country given that someone has to pay to run the country.

If I had my way, I would abolish the states and cut billions from the cost of running the country. But I know that will never happen because Australians would never vote for a referendum to do that and so we are pretty much stuck with the bill as it is. Can’t we at least come together for the good of the country and put aside our personal interests for long enough to capture this powerful vision of a better, fairer, more productive tax system?

Sunday, May 23, 2010

One percent realty – a revolution in the making

Real estate agents have a poor reputation.  The cynical side of me would say that they get paid a lot for doing very little.  Unspoken collusion results in an unwillingness to negotiate commission from the maximum allowable, which, under the Property Agents and Motor Dealers Regulation 2001, is $900 plus 2.5% if the price is over $18,000.  Almost ten years on residential property prices have increased is many areas by 300%, yet agents still typically charge this maximum amount in a 'take it or leave it' fashion.

But things are changing fast. 

Economists often proclaim that market failures are best remedied by the market, since governments are very bad at improving outcomes even if they have the best intentions. I previously raised the possibility of government establishing a centralised real estate exchange to improve the efficiency of the property market.

Imagine a real estate exchange (REE) where home owners could list their properties. Maybe each property has a list of compulsory documentation to be included – Survey plan, title, aerial photo, front photo, number of rooms, bath, bed, total covered area, building materials, age, car spaces, maybe pest inspector and engineers reports.

The house would be put up on the exchange, which could be searched by any of the characteristics. The seller would nominate a price and contract conditions they are willing to accept, and buyers would nominate a price in a kind of open auction process.

There would be no time limit, and people could keep their house in the exchange at a ridiculously high price, and if someone agreed, they would be forced to enter the contract, even if it was a bit of a joke - “just testing the market” or something like that.
Now I am happy to say that this type of intervention is unlikely to be required.  Market forces are removing inefficiencies in real estate transactions.

The market dominance of the main on-line real estate search website, realestate.com, and the centralised map based searching for residential rentals and sales listings on Google Maps, is bringing buyers and sellers together – greatly diminishing search costs for buyers.  Google maps for instance allow any individual to list their home, and as it becomes a more prominent search tool, may surpass realestate.com, who only accepts listings from licensed real estate agents, as the main real estate website.

Not only is the centralising of information taking place, but competition amongst real estate agents is heating up.  In a revolutionary spirit I recently sold a house with One Percent Realty, where, as the name implies, the total commission is 1% of the sale price. 

My experience has been fantastic, and by all accounts (recommendations by friends), so has the experience of others who have sold with One Percent.  It is by far the best service from a real estate agent at a fraction of the price. 

GoGecko is also competing strongly with commissions capped at $5,950, although I have heard no first hand experiences with this agency (let me know if you have).  No doubt this trend will pressure others to follow although I have not yet heard of traditional agents entering into negotiated fees.

The reduced commission gives a seller a massive edge over properties on the market with colluding traditional agents charging the maximum commissions.  For a $500,000 home, a seller is $8,400 better off to sell with One Percent Realty.  

This type of competition works due to the centralised nature of internet searching for real estate.  The agent no longer needs to have a prominent office in ‘their’ area, distribute glossy brochures, or advertise in traditional print media.  Real buyers are online searching for property.  Browsers and neighbours are the only ones reading newspaper listings.

I have taken this experience as a lesson.  While markets may fail, over time they can be better are becoming efficient without government intervention than with.  

Thursday, May 20, 2010

Housing and population updates

Australian housing finance is falling rapidly with prices likely to follow.

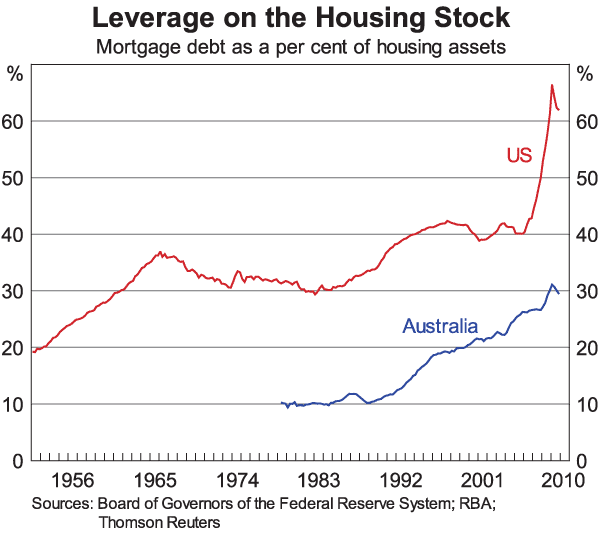
This graph of historical prices and housing finance approvals deserves a look. Also, the graph below was part of the RBA's Luci Ellis' speech on housing last week and was referred to as follows:

Australian housing debt is higher relative to housing assets now than in the past (Graph 4). We should expect this ratio to be higher than in the 1970s and 1980s. The financial regulation of that period artificially restricted household borrowing. For example, unmarried women found it hard get mortgages back then. The question is whether this measure of leverage is higher than can be sustained. After all, it is much lower than in the United States, even before their boom-bust cycle. But we should expect that to be true. Because they can claim home mortgage interest against their tax, American owner-occupiers have less incentive to pay their debt down than their Australian counterparts.
...
Recent data suggest that we do not have a credit-fuelled speculative boom on our hands.


I wonder what data would be required for Ellis to conclude otherwise? If it was so easy to see a speculative bubble in the data, none would ever form.

Finally, a word of caution about the graph. It is the ratio of debt to value. Therefore a rise can be caused either by an increase in debt or a decrease in home values. Clearly the dramatic lift in the US ratio in 2008-09 was caused by declining asset prices, not increased debt.

Strangely Ellis concludes that a 40% aggregate debt ratio was a massive bubble in the US, but 30% in Australia is not apparently, even though we should expect this relationship due to differential tax treatment of mortgage interest.

The RBA is sounding very confused these days.

On another note, the 'population growth increases house prices therefore the Australian market is safe' point of view is looking very shaky. Latest BIS Shrapnel report forecasts significant declines in population growth in the coming years.

BIS Shrapnel says annual net overseas migration - which includes permanent migration and longer-term but temporary stays - will fall from its pace of 298,900 in the year to June 2009 to 240,000 in the year to June 2010. It will fall more dramatically to 175,000 in 2010-11 and 145,000 in 2011-12.

Friday quick links

Latest research suggests that government owned banks are better for growth than private banks.

Another potential rebound effect - encouraging snus instead of cigarettes might lead to another avenue for nicotine addiction and potentially more cigarette use.

A belief in supernatural communication with the dead must surely be evidence for irrationality

One reason (not) to get an iPad - freedom from porn

Tuesday, May 18, 2010

Lower bound problems of hedonic indices

Prices are fundamental features of modern economies, yet measuring price changes is exceedingly difficult due to the constantly changing quality of goods and services. I have previously discussed the use of hedonic price indices, where adjustments are made for quality changes using regression techniques, and the potential pitfalls when interpreting the result from this method. I apologise for raising this issue again, but I hope to clarify my message with an example.

While a hedonic index is a useful tool, and when part of a package of price indices can clarify our understanding of price and quality movements, many unresolved issues persist. One issue that attracts little attention is how to interpret and apply results from hedonic price index calculations.

Today I want to further elaborate upon, and demonstrate using the table below, what I call the lower bound problem of hedonic price indices. Quality improvement does not imply that prices faced by consumers have dropped, especially if lower quality goods are no longer available. Buyers of cheaper products will not see the price declines measured by a hedonic index, and may even see price increases.


The above table has been constructed to show how different methods for determining price changes can produce significantly different results. This hypothetical market could be computers, cars (add a zero to the prices) or any other market where quality changes noticeably over time.

The animal names are the models. For car markets it they could be Corolla, Landcruiser and so on, or for computers, Dell Latitude, Apple MacBook or any other model. The reason to include models is that one method for determining price changes is called the model matching technique. Because models typically have fewer quality changes than the market as a whole, and that they typically represent a segment of the market (budget / premium), compiling prices over time for the same model can give a reasonable measure of price changes for similar quality products. In the table above two models are highlighted, Kangaroo and Echidna, to show how their prices have changed over the period. If we take the average price change of models we can match over the period (the model matching technique), we get a price change in this market of -42% over the eight year period.

The number beside each model is a measure of quality. I have used a single number in this situation, but typically there would be a number of associated quality measures. You will note that the quality of each model improves over time, thus if we use a hedonic (quality controlled) method for measuring price change, it will show a more substantial price decline. If we were to buy a ‘quality level 9’ product in 2001 it would be $3,000, while in 2009 it would be $1,000 – a 67% decline in price.

Using a median price index, where quality is not considered, the data in this table shows a median price increase of 14% over the period (assuming equal volume of sales in each price category). In this scenario this measure more accurately shows the movement in price of the market as a whole. If you wanted to stay at the same level in the market, this is the price change you would experience.

Finally, and this is the main pitfall when utilising quality adjusted prices measures to make policy decisions, the price change for the lower bound market entrant has increased 33%. The cheapest computer/car/shoe/phone/appliance or whatever good this happens to be, has gone up in price significantly while the quality adjusted measures show large declines.

Measures such as the CPI (a price index) and the Analytical Cost of Living Indexes do consider quality change, yet we apply these measures as a way to adjust welfare payments, even thought most welfare recipients will be lower bound market entrants for much of their consumption bundle.

In an ideal world a selection of price indexes using different methods would be produced for each major consumption category to show paint a clear picture of the situation being faced by a different members of society. Not only would we measure ‘pure price change’, but also changes to the cost of living which can more easily guide policy making.