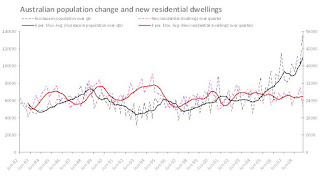
Below is the graph that apparently makes quite obvious the current housing shortage (the scale is such that the ratio between the two variables is set at the last decades average occupancy rate). I measure shortage first by establishing the underlying demand for new dwellings as change in population divided by occupancy rate (which changes through time as well), then subtracting new dwellings completed. (I wanted to then add demolitions of residential dwellings, but it appears that the ABS does not collect such data, and after a brief chat with them, they don't know of anyone who does collect it. In fact, determining a reliable collection method is one of their current projects. If anyone knows who is collecting it, and how reliable it might be, I would love to know; as would the ABS).
At first glance, yes, the housing shortage appears to be getting out of control. But I think what matters is how this comparison of population growth and new housing completions can be useful in forecasting the future behaviour of the market. Below, the ABS capital city price index is also plotted, and shows a surprising relationship with the shortage.
The plot below shows the relationship between change in shortage and change in price. A quick regression shows a significant negative correlation between change in shortage and change in price, even when the shortage is lagged a little.
This is what makes me wonder if we all have this forecasting thing backwards. If the housing shortage declines (by way of adjustments in occupancy rates, conversion of non-residential to residential, dramatic reduction in population growth), would that signal an increase in prices is imminent?
What theory could explain this relationship? My suggestion relies on the fact that the demand and supply of housing are interrelated - that is, they each react to the other, and the price change is a signal for actions by both sides of the equation. Ceteris paribus (including constant incomes), we have a number of reactions to a price change on both the supply and demand side.
1. When the rate of price growth increases, occupancy rates increase, to reduce the effect on a per person housing cost, which in turn decreases demand.
2. When the rate of price growth increases, supply increases as developers can now build more profitably.
3. When rate of price growth declines, occupancy rates decrease as people can afford more space per person.
4. When rate of price growth declines, the supply of new dwellings slows dramatically.
How can that make sense? If we follow this through, an increase in the rate of price growth is a signal that demand is declining but supply is rising! And vice versa. A decline in rate of price change signals a increase in demand and a decrease in supply!
I am pretty sure that the market is not so simple that it can be deciphered by comparison of population growth and dwelling construction.


.JPG)
No comments:
Post a Comment