Sunday, May 8, 2011

1980s Texas Housing Bubble Myth - A Reply

Recently the debate on the price impacts of planning regulations has been a hot topic here and elsewhere. Leith van Onselen at Macrobusiness is one of the more sophisticated proponents of supply side impacts on home prices and recently responded to a comment of mine about Houston Texas. My comment was that if Houston is an example of how responsive supply can help cities avoid house price volatility, why did Houston experience a house price bubble in the 1980s?

Leith argued that Houston's apparent price bubble was a mere mild blip, especially on the grounds of price to income multiples. In his typically evenhanded fashion Leith does note many of the demand side factors at play during that time - the oil boom, liberalisation of loan standards and population growth. He brings together these points with the following conclusion.

What makes Texas’ home price performance in the early 1980s particularly impressive is that prices managed to remain relatively stable in the face of significant demand-side influences that should have caused home prices to rise significantly and then crash.

An additional point is made that Houston has managed to avoid the 2000s property bubble infecting most of the rest of the US, and much of the world.

My reply.

Houston prices declined around 40% in real terms following the 1982 market peak - that is indeed volatile - and it took 15 years for prices to recover in nominal terms.  The Case-Shiller 10 city index has dropped by a similar amount since the US peak in 2006 (30.5% nominally) - so much for the volatility aspect.

But why do prices in Houston still appear so dramatically affordable?

One major reason is the relatively high property tax rate.

Property tax rates in Houston more that doubled from 1984 to 2007 becoming one of the highest rates in the US. Depending on your area you can pay between 2-3% of your properties improved market value in annual State taxes, while the US National average is 1.04%.

One would expect areas with higher property taxes to have structurally lower prices, reduced price volatility, and much lower price to income ratios.

An illustrative example is shown below. The three comparisons are intended to roughly represent the early 1980s, the early 2000s and today. The Houston property tax rates increase from two to three percent, while the comparison taxes increase from half to one percent. Interest rates also represent mortgage rates at the time.

From these examples we can see that from just this single factor, the property tax differential, we should expect prices in Houston to currently be structurally around 30% lower than national averages (more on the impact of the property tax differential here).

An important factor at play in this example is that at lower interest rates a fixed percentage property tax leads to greater price differences. Therefore, over time, we would expect Houston to home prices to be a smaller fraction of comparable homes elsewhere as the property tax differential has a greater price impact at lower interest rates. Remember in the table above, rents and returns are the same for each comparison - only the tax rate is different.

Of course, this does not mean that housing is lower cost. It just means that cost of housing is borne by annual tax obligations rather than capitalised in the price. A far better comparison of whether housing is structurally cheaper in Houston would be to compare quality-adjusted rents to incomes over time and across cities.

Perhaps once the property tax differential and other demand side factors are properly considered we will see Houston's supply-side impact on housing prices diminish to zero.

Lastly I would add that the memory of such a deep and prolonged property price slump would be motivation enough to dampen speculative housing demand in Houston. Who in their right mind would bid up prices in Houston knowing that increased tax liability and the history of dramatic losses on the property market?

Evidence of supply-side effects on home prices remains elusive.  

Thursday, May 5, 2011

A sign of desperate times?

Saw this advertisement today in the Financial Review.  I haven't seen anything like it before but it reeks of desperation.  Is it some kind of joke?

I like the first part of the fine print "Real Estate agents tell me I can get $2.1million for my luxury home but..."

Wednesday, May 4, 2011

Rent seeking behaviour - scare campaigns


From the Hungry Beast

Housing stimulus idea

From Crikey:

Local bike paths mean higher house prices

That is one housing stimulus package I would be happy to see implemented.  From the comments section:

More accurate take on alternate headline –
Bikeways found to be desirable trait amongst urban home buyers.
Temporary shortage of bikeways elevates prices in areas with bike paths.
Once all areas have bike paths, price distortion will be nil.

Captain Planet

Demand shocks – the details

Many pundits claim that increasing population increases demand. In technical economic jargon it shifts the curve to the right. But what we rarely see is an exploration of the two types of demand shock and the different potential price impacts.

The first type, as mentioned above, shifts the downward sloping demand curve to the right. This means there are more people with the same willingness to pay.

The second type is a shift of the demand curve up upwards. This represents a willingness to pay more for the same goods from the same number of people.

It’s pretty clear from this distinction which of these factors is in play in Australian housing.

Let’s examine the first case. Consider an auction with 10 cars for sale and 50 bidders willing to pay $1000 for a car. You add another 50 people to the mix each also willing to pay $1000. If I’m not being clear enough, this is analogous to increasing population in the housing context.

When the auction is run with the original 50 bidders each car sells for $1,000. When the auction is run with 100 bidders, the 10 cars still sell for $1,000 each.

This is an extreme scenario but does demonstrate a very real point. Unless the new potential buyers are willing to pay more for the same items as the existing buyers, the price won’t rise. At most, a second price auction (the result of an English open auction with heterogeneous preferences) becomes closer to a first price sealed bid auction by the addition of another bidder willing to bid at a price between the second and first price (read up on some auction theory here).

As I said before, new buyers, even a small cohort of the total market, can influence the price level if they are willing to pay more than the existing buyers, since prices are set at the margins. Imagine our car auction once again, and we give 10 of our original 50 bidders and extra $500 to spend on the car. What is the new result? All cars sell for $1500 each to these 10 bidders. Even though they were just 20% of the original market of buyers, they dragged the price up 50%. In fact even if there were thousands of buyers willing and able to pay $1000 for those 10 cars, the ten people willing to pay $1500 would always win.

Prices are set at the margin by those with the highest willingness to pay.

This example, where the demand curve is shifted vertically to reflect an increased willingness to pay by the same number of buyers, is shown graphically in the right hand side graph above.

But, you say, the key problem here is that supply is being overlooked - in the simplified examples demand curves are horizontal and there is no supply response. But look at the graphs again. Not only is the demand curve a more acceptable shape, but supply does respond in both circumstances. In the first, where the demand profile of buyers shifts horizontally supply does respond enabling prices to remain at their equilibrium level.

However, when the demand curve shifts vertically, it doesn’t matter how much supply responds to price increases, it cannot be a mechanism to bring prices back down (except under extreme assumptions about the shape of demand and supply and the limits of peoples willingness to pay at the top and bottom of the market).

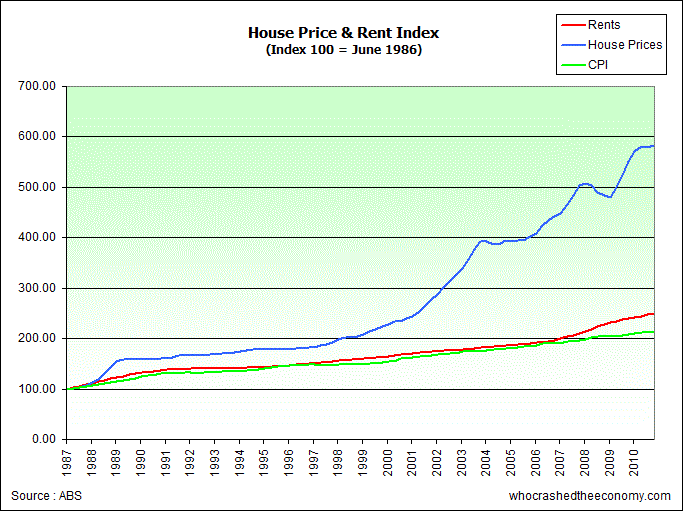
Of course, in the end this analysis is probably unecessary. The value of housing arises from the rents - its ability to generate revenue or provide a service. Since we haven’t seen rents outpace inflation significantly for any extended period in the past two decades, one must be quite certain that the cause of prices being much higher than a rational present value of future cash flows is pure demand side speculation.

Economics, Real Estate and the Supply of Land

As a general rule, economists relying on supply and demand curves without properly discussing the assumptions that sit underneath their graphs can be ignored.

Alan Evans' book Economics, Real Estate and the Supply of Land is an effort to refute Ricardian notions of land supply and rent, and offer an alternative neoclassical theory of land supply. The arguments in this book are taken by many who believe that reducing government involvement in town planning will decrease the price of housing. Evans’ reasoning is questionable to say the least, and supported by elaborate graphs with often biased assumptions and interpretations.

One of Evans’ aims is to refute the Ricardian proposition ‘that the price of land is high because the price of corn [read: houses] is high, and not vice versa’.

To do this he constructs a model economy with a fixed land supply where two agricultural uses compete for land – potatoes and corn. In the figure below we see his construction of this economy on the left, with demand for corn inverted so that the intersection of corn and potato demand determines the equilibrium share of land devoted to each crop, and the equilibrium rent of land at point A.

He then proceeds to add a demand shock to potatoes ‘for some reason’. The new blue line represents the new increased demand for potatoes which enables potato growers to bid up prices for land previously grown for corn and reduce the amount of land used to grow corn. He concludes with the following -

Now it is quite clear that the increase in the rent of land is not caused by the increase in the price of corn. Exactly the reverse is true. The price of corn has risen because the price of land has risen.
...
The rent for land is not solely determined by the demand for the product.


His conclusions are wrong.

First, it is still quite clear that at the new equilibrium the price of land for corn is still determined by the new higher price for corn. You could just as easily argue that every time a potato grower buys land from a corn grower he decreases the output of corn and the price of corn rises, thereby leading to an increase in the rents of land available for growing corn.

Second, he fails to notice that all he has done with the model is to demonstrate the inflation mechanism following an increase in money supply for one purpose. He increases total demand (potatoes plus corn) but shifts preferences towards potatoes so that corn demand is constant. The end result of his demand increase is to increase all prices in the model economy – potatoes, corn and rent.

Followers of Say would jump straight to this conclusion. You can’t simply increase total demand in the economy – demand is comprised of supply.

An actual demand shock, which models a change in preferences from corn to potatoes, is shown in the right hand side figure. You will notice that total demand remains constant and therefore the rents for this fixed quantity of land also remain constant.

So no, land rents do not determine prices. Prices determine rents.

Another example of poor reasoning is when Evans argues against a 100% land value tax. He argues that a tax of that nature would ‘freeze’ land development because there would be no incentive for a owner of agricultural land to sell his land to a developer for housing development, since he would not capture any of the value uplift. The rent achieved by the owner of the land will remain the same as when it is rented to the farmer – zero.

Yet in chapter 8 he argues that the value of land grows in anticipation of future higher value uses. In these cases, when the site is genuinely worth more as housing, the tax would be at a rate that reflects that higher value, and not the agricultural value. Therefore, the owner of the land will be facing a tax on the land value for housing while only receiving rents at agricultural values. As the city expands and the value of his land for housing surpasses the value for agriculture, he has a great incentive to sell or develop immediately to avoid losses.

Although I don’t support a 100% land value tax, I do support shifting the tax burden towards land and fixed rights to natural resources.

What we do learn from this book is that even the experts are prone to bias that affects their ability to apply objective logic and reason.

SOA, the User Interface Service Components, Apps, and Validation before Registering

System Architecture and the User Interface
In an article I wrote for The Northrop Grumman Technical Review Journal, entitled Service-oriented Architecture and User Interface Services: the Challenge of Building a User Interfaces in Services, I described five functional categories of user interfaces that a system architect might use to enable a user to employ  for an SOA-based Composite Application.  These included: Thin Client, Portal, Rich Client, Smart Client, and Rich/Smart Client.  I describe the characteristics sub-functions of each such that a system architect be able to determine which would serve the Composite Application's user best. 

In the article I linked the user interface categories to three categories of users (not my categories, but I could not track down the source), informational, transactional, and authoring.  An informational user is one who uses data and information in an ad hoc (through search and discovery methods) or regularly to retrieve information from one or more sources.  The data flow is primarily to the user.  Many commercial cable companies set up their networks for this type of user; with data rates twice as fast to the customer of the data and to the supplier of the data.  A transactional user is one who repetitiously inserts and/or retrieves the same type of data from an application.  For example, the office administrator in a doctor's office makes appointments, that is, he or she looks up on a calendar for dates and times that are open and then inserts an appointment.  For organizations, including businesses, the vast majority for the uses of data and user interfaces are of this type.  Finally, there is the "authoring" use.  This customer function is the most creative and would include: programming, document, video, and audio file creation and editing, engineering, verification and validation, and enumerable other content creation.  Creating a user interface for the authoring category is the most complex because this service links to the most complex functions of an application.

There were two reasons for writing this article.  First, for SOA-based Composite Applications, to demonstrate that the user interface could be built in Service Components, as there was a good deal of discussion between myself and my colleagues on this point.  Second, to demonstrate the patterns that a System Architect can use in the activity of decomposing the customer's system requirements and deriving the functional requirements, which is a key step in the system architecture process.

An Example
While a functional design for the user interface Service Component may seem like a semi-useful abstraction, Apple seems to have intuitively understood the concepts very well.  For those versed in SOA, an Apple "App" is simply a Service Component.  It performs a single function or a small group of closely coupled functions (in a system architecture sense), for the user.  Apple, and subsequently many other suppliers of wireless user interface devices, are now selling these User Interface Service Components.  Most of them are for the informational user, if you can call streaming a movie informational--the functional concept is the same.  Likewise stock quotes, news feeds, the weather radar real time image, the restaurants closest to the user (with customer critiques), and earth images of the user's current location (i.e. navigational maps) are all informational, that is, they are likely used on an as needed basis, or semi-regularly, to gain data and information about what is going on in the environment that affects them.

Even Apple's iTunes and Apps store are informational in that they link to discovery and download functions (services) on the server-side of the system.  There are Apps, like playing music, games, and currently, the calendar, that are standalone applications (functions), but even the camera function (service) is loosely couple with the e-mail user interface Service Component.  Consequently, the system architecture of the new mobile devices is, in fact, SOA-based, they just don't want to call it that.

As further proof, Apple is treating their Apps the manner a Service Component supplier should be treated.  Apple has significant verification process to ensure that Apple's policies and standards are met, before the App is offered to customers.   That is, Apple is verifying the Apps, the way all Service Component supplier should verify Service Components, especially, a user interface Service Component.  These include meeting security and dependability standards, as well as having a Service Component Description.  The Apps Store serves as the Service Component registry and discovery function in the SOA-based architecture.

Consequently, this is an excellent example of an SOA-based architecture (though it really doesn't use Web Services).

For more on SOA see SOA in a Rapid Implementation Environment, Enterprise SOA vs Ecosystem SOA, Private Cloud Computing vs Public Cloud Computing, Choreography vs Orchestration: Much Violent Agreement, and SOA Orchestration and Choreography Comparison.  For more on System Architecture see SOA in a Rapid Implementation Environment, Enterprise Architecture and System Architecture, and Lean or Agile Enterprises and Architecture.